- there are 3 types of cones where each type responds differently to different wavelengths of light; these responses are called tristimulus values (X, Y, Z) and they are functions of wavelength
- these X, Y, Z are integrated responses where the response of each cone type = sum of responses to the individual wavelengths of light
- if we get X, Y, Z from tables of experimental results, we can calculate x and y
- the sum X+Y+Z is called the total integrated response; we "normalize" values by dividing by this to calculate the chromaticity coordinates x, y and z. (eg. x = X/(X+Y+Z))we use these chromaticity coordinates to describe a colour (but we really only need x and y since z=1-x-y and is easy to calculate)
- each colour plots a point in the chromaticity diagram; if a source producing light at just one wavelength is swept through the range 400-700 nm, it traces out the curve of the shark fin
- since the colour purple can't be produced by a single wavelength (it needs a combination of short and long wavelengths), there is a "line of purples" joining extreme blue to extreme red across the bottom of the shark fin diagram


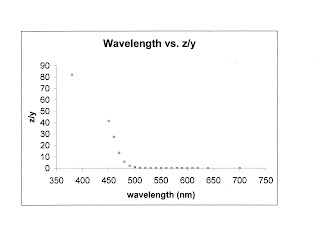
What do these graphs represent?
Clearly, the middle graph (wavelength vs. y) is just a plot showing the response of the "green" colour receptors to varying wavelengths of light.
As for the other two graphs, http://en.wikipedia.org/wiki/CIE_1931_color_space notes:
The CIE XYZ color space was deliberately designed so that the Y parameter was a measure of the luminance of a color. The chromaticity of a color was then specified by the two derived parameters x and y, two of the three normalized values which are functions of all three tristimulus values X, Y, and Z:The derived color space specified by x, y, and Y is known as the CIE xyY color space and is widely used to specify colors in practice.The X and Z tristimulus values can be calculated back from the chromaticity values x and y and the Y tristimulus value:
X=(Y/y)x and Z=(Y/y)z
What does this mean for the graphs? I'm not sure. The (x/y) is the multiplier that would convert Y into X, and the (z/y) is the multiplier that would convert Y into Z. So, this question would make a lot more sense to me if we were given the Y values as well and asked to graph wavelength vs. Y*(x/y), Y and Y*(z/y) since those graphs would represent the original X, Y and Z tristimulus responses.
2. Consider any two valid colours, c_1 and c_2 with coordinates (x_1, y_1) and (x_2, y_2) in the chromaticity diagram of Figure 6.5. Derive the necessary general expressions for computing the relative percentages of colours c_1 and c_2 composing a given colour that is known to lie on the straight line joining these two colours.
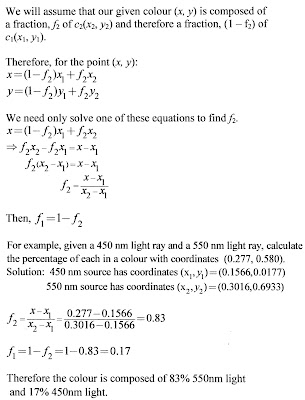
And, yes OK if c_1 and c_2 lie on a vertical line then this calculation won't work. In that case, use the analogous results based on the y-coordinates. So f_2 = (y-y_1)/(y_2 - y_1).
3. Consider any three valid colours now c_1, c_2 and c_3 with coordinates (x_1, y_1), (x_2, y_2) and (x_3, y_3) in the chromaticity diagram of Figure 6.5. Derive the necessary general expressions for computing the relative percentages of c_1, c_2 and c_3 composing a given colour that is known to lie within the triangle whose vertices are at the coordinates of c_1, c_2 and c_3.

4. a) Sketch the CMY components of the image in problem 6.6 as they would appear on a monochrome monitor.


b) If the CMY components sketched in a) are fed into the RGB inputs of a colour monitor, respectively, describe the resulting image.
Once an image has been converted into CMY colour space, it cannot be displayed correctly on a computer monitor since the monitor requires input in RGB form. If the CMY components from a) were fed into the RGB inputs of a colour monitor, respectively an inverted, or negative colour image will be seen (Source: www-viz.tamu.edu/faculty/parke/ends489f00/notes/sec1_4.html).
So, the 8 strips in the image will be coloured (left to right): white, cyan, blue, magenta, red, yellow, green, black. The outside border will still be gray.
5. What is the transformation on the RGB coordinates of the image which inverts the colours of the image?
The transformation to the complement is:

What effect does this transformation have on the HSI coordinates of the image?
The equations for hue, saturation and intensity could be modified by replacing R with 1-R, G with 1-G, and B with 1-B since these represent the complement transformations. When this is done, the equations look like:
The textbook (pg. 430-431) illustrates how each of the hues in the complement image can be predicted using the corresponding input colour. This could theoretically be done using the equation above, but not tonight.
The text, in its solution to exercise 6.18, points out that the saturation component of the complement can't be predicted from the saturation component of the input alone (www.prenhall.com/gonzalezwoods). In fact, the saturation depends on the hue. If the original image had red as the dominant colour, the transformed image will have red as the minimum colour. If the original image had blue as the dominant colour, it will be the minimum colour in the transformed image. Similarly, if the original image had green as the dominant colour, it will be the minimum in the transformed image. Since the minimum colour is the limiting factor which determines the saturation (since all 3 colours have to be at least at this level for finding the amount of gray), the dominant colour from the original image will determine the saturation for the transformed image. And even then, many different colours have the same saturation value so as the text solution points out, the same starting saturation can result in two different complementary colour saturations.
The intensity of the transformed image will be equal to 1-I of the original image.
6. a) Saturation and intensity don't change. For the hue, theta -> (240 - theta) for values between 0 and 240 degrees. For values of theta between 240 and 360 degrees, theta -> (300-(theta - 300)). Note that this is equivalent to a reflection (or flip) across the "green-magenta" axis in the colour wheel.
b) Here is the chromaticity diagram with the red and blue channels exchanged:
Here are the Photoshop instructions: (source: http://www.deborahsandidge.com/-/deborahsandidge/article.asp?ID=2903)
Step One: (Layer>New Adjustment Layer>Channel Mixer). Start with the output channel set to red (default).
Step Two: Adjust the source channels, moving the red channel slider from 100% to 0, and increase the blue channel slider from 0 to 100%.
Step Three: Change the output channel to blue, and increase the red source channel to 100%.
Step Four: Change the blue source channel to from 100% to 0% to exchange the blue channel for the red.
No comments:
Post a Comment